


Tank Gauging: Reading the Numbers
A gauge report turns a few millimeters of level into thousands of barrels. Here is how the readings are taken, what each line means and how to check a delivered quantity yourself.
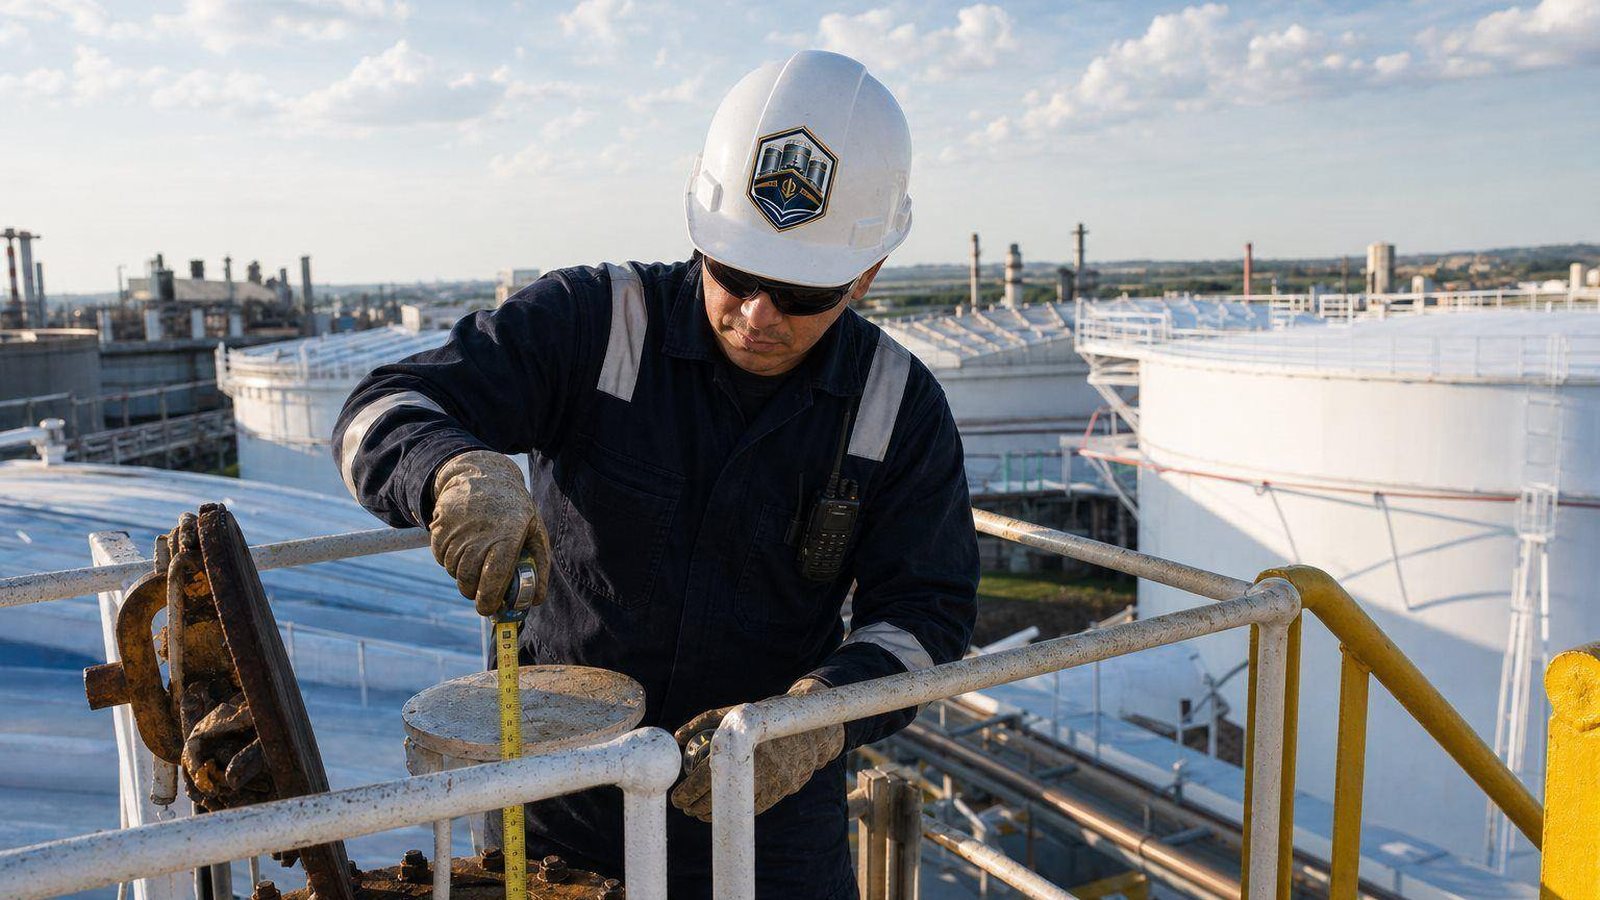
Tank gauging is the measurement of liquid level in a storage tank, together with the temperature, water and samples needed to turn that level into a standard quantity. It is the basis of most shore-tank custody transfers and of every inventory figure a terminal reports. The governing practice sits mainly in API MPMS Chapter 3 for gauging, Chapter 7 for temperature and Chapter 8 for sampling.
Gauging looks simple and is unforgiving. On a large tank a few millimeters of level represent many barrels, a temperature error of one degree shifts the corrected volume, and a sample drawn from the wrong depth misstates the water. Knowing the method lets you read a report critically instead of taking the bottom line on trust.
Innage, ullage and reference height
There are two ways to measure level by hand. An innage, or dip, runs from the datum plate at the tank bottom up to the liquid surface. An ullage, or outage, runs from the reference point at the gauge hatch down to the surface. Because the reference height, the fixed distance between the two, is known, either reading gives the other: innage equals reference height minus ullage.
- Innage gauging suits lighter products and tanks with a clean datum plate
- Ullage gauging suits heavy or viscous products, where a tape cut deep in the tank is hard to read
- Observed reference height is checked at every gauge; a change can mean sediment, a damaged plate or shell movement
Manual gauges and automatic tank gauges
Terminals run automatic tank gauges (ATGs) for continuous inventory and overfill protection, and use manual gauging to verify them or as the custody basis where a contract requires it. Both have a place. The questions for a buyer are which method the contract names, and how the two are kept in agreement over time.
| Method | How it works | Notes |
|---|---|---|
| Manual tape and bob | A certified steel tape is lowered through the gauge hatch and the product cut is read on the tape | The reference method; operator skill and weather affect results |
| Servo gauge | A displacer on a wire follows the liquid surface while a servo motor tracks its position | Can also measure interface levels and density |
| Radar gauge | A microwave signal reflects off the liquid surface, in free space or inside a still pipe | No moving parts in contact with the product |
| Hydrostatic gauging | Pressure transmitters infer mass and density from the liquid head | Covered by API MPMS Chapter 16 |
| Float and tape | A mechanical float drives a tape to a gauge head | Older installations, generally for inventory rather than custody |
Temperature, water and samples
Level is only the first number. Product temperature drives the volume correction, so in tall tanks it is taken at several depths and averaged, by portable electronic thermometer or by a multi-point averaging sensor. Free water is found at the bottom with water-finding paste or an interface probe. Samples drawn at specified levels go to the laboratory for density, sediment and water and specification tests.
Worked example: opening and closing gauges
A hypothetical diesel delivery from one shore tank, in metric units. Density at 15°C is 840.0 kg/m³. The capacity-table volumes and VCFs are illustrative, and floating-roof and shell corrections are left out for clarity. Free water is unchanged between the two gauges, so none left the tank.
Delivered GSV is the difference: 51,894.1 minus 11,351.8 equals 40,542.3 m³ at 15°C. With no measurable sediment and water in the delivered diesel, NSV is the same. Converting to weight in air with a factor of 0.8389 t/m³ (density less 1.1 kg/m³ for air buoyancy, divided by 1,000) gives 34,010.9 metric tons.
| Line | Opening | Closing |
|---|---|---|
| Innage | 14.250 m | 3.120 m |
| TOV from capacity table | 52,310.0 m³ | 11,452.0 m³ |
| Free water | 18.0 m³ | 18.0 m³ |
| GOV | 52,292.0 m³ | 11,434.0 m³ |
| Average product temperature | 24.0°C | 23.5°C |
| VCF, Table 54B (illustrative) | 0.99239 | 0.99281 |
| GSV at 15°C | 51,894.1 m³ | 11,351.8 m³ |
Checking a gauge report
Run down this list whenever a report reaches you. If any item is missing or inconsistent, ask before you accept the figure. A gauge report that cannot be traced back to these basics is a number, not a measurement, and it will not hold up when a counterparty or an insurer questions it.
- Same tank, same gauge point and same method at opening and closing
- Observed reference height recorded and consistent with the certified figure
- Temperatures taken at enough levels for the liquid depth
- Free water measured at both gauges, not assumed
- Floating roof clear of its critical zone at both gauges, or the correction explained
- Line condition confirmed full or empty at both ends of the transfer
- Capacity table identified, with its calibration date
How it works
- 1Verify
Check reference height, tape certification and that tank valves are closed and sealed.
- 2Gauge
Repeat level readings until consecutive results agree within the tolerance the standard sets.
- 3Temperature
Measure at the number of levels the liquid depth requires and average them.
- 4Water and samples
Find free water at the bottom and draw samples at the specified levels.
- 5Record
Witnesses sign the gauge report before any further movement on the tank.
Frequently asked questions
Why do ATG and manual gauges sometimes disagree?
Common causes are shell movement as the tank fills or warms, a shifted reference point, still-pipe effects and plain calibration drift. Terminals compare the two regularly and adjust the ATG when the difference exceeds the agreed tolerance. For custody, the contract says which reading governs.
What is a capacity table, and why does it matter?
It converts level into volume for one specific tank. It is produced by calibrating, or strapping, the tank: measuring its circumferences at several heights, its bottom shape and its internal fittings. Every shore-tank figure depends on it, so its date and method matter.
What is the difference between free water and S&W?
Free water is a separate layer lying beneath the product, measured by gauge and deducted as a volume. S&W is water and sediment suspended within the product, found by laboratory test on a sample and deducted as a percentage when moving from GSV to NSV.
Can I attend the gauging of my product?
Yes. Receipt holders and their appointed inspectors may witness opening and closing gauges by arrangement with our terminal team. Arrange attendance in advance so that access, safety induction and timing can be confirmed before the transfer starts.
Related
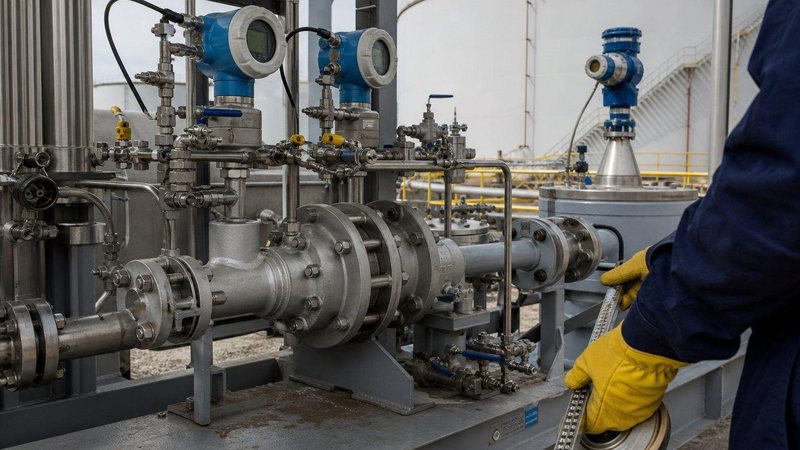
Custody Transfer Measurement
Tank gauging, meters and provers, sampling and volume correction to API MPMS standards.
Read more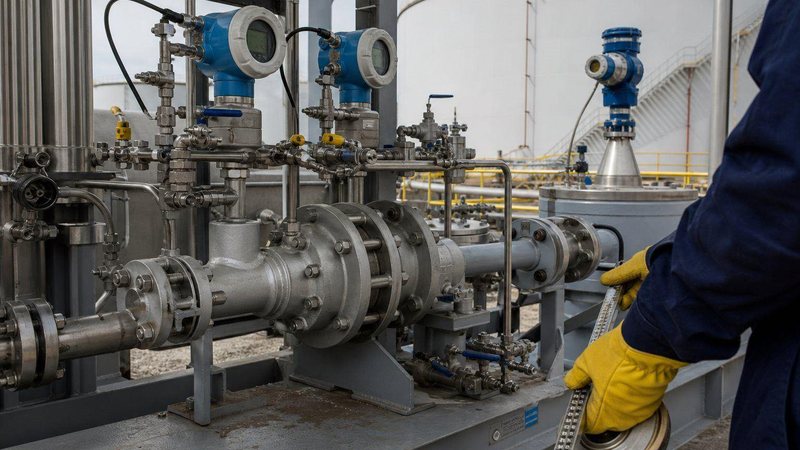
Custody Transfer, Explained
From TOV to NSV to metric tons: the quantity chain behind every invoice, with a worked example.
Read more
Buyer / Receipt-Holder Portal
KYC-verified buyers see grade, quantity, tank, status and documents for the product they hold.
Read moreWant to witness a gauge?
Receipt holders and their inspectors can attend opening and closing gauges by arrangement with our terminal team.